
Expected Goals (xG) in Football: What It Means, How It Works & How to Use It for Match Predictions
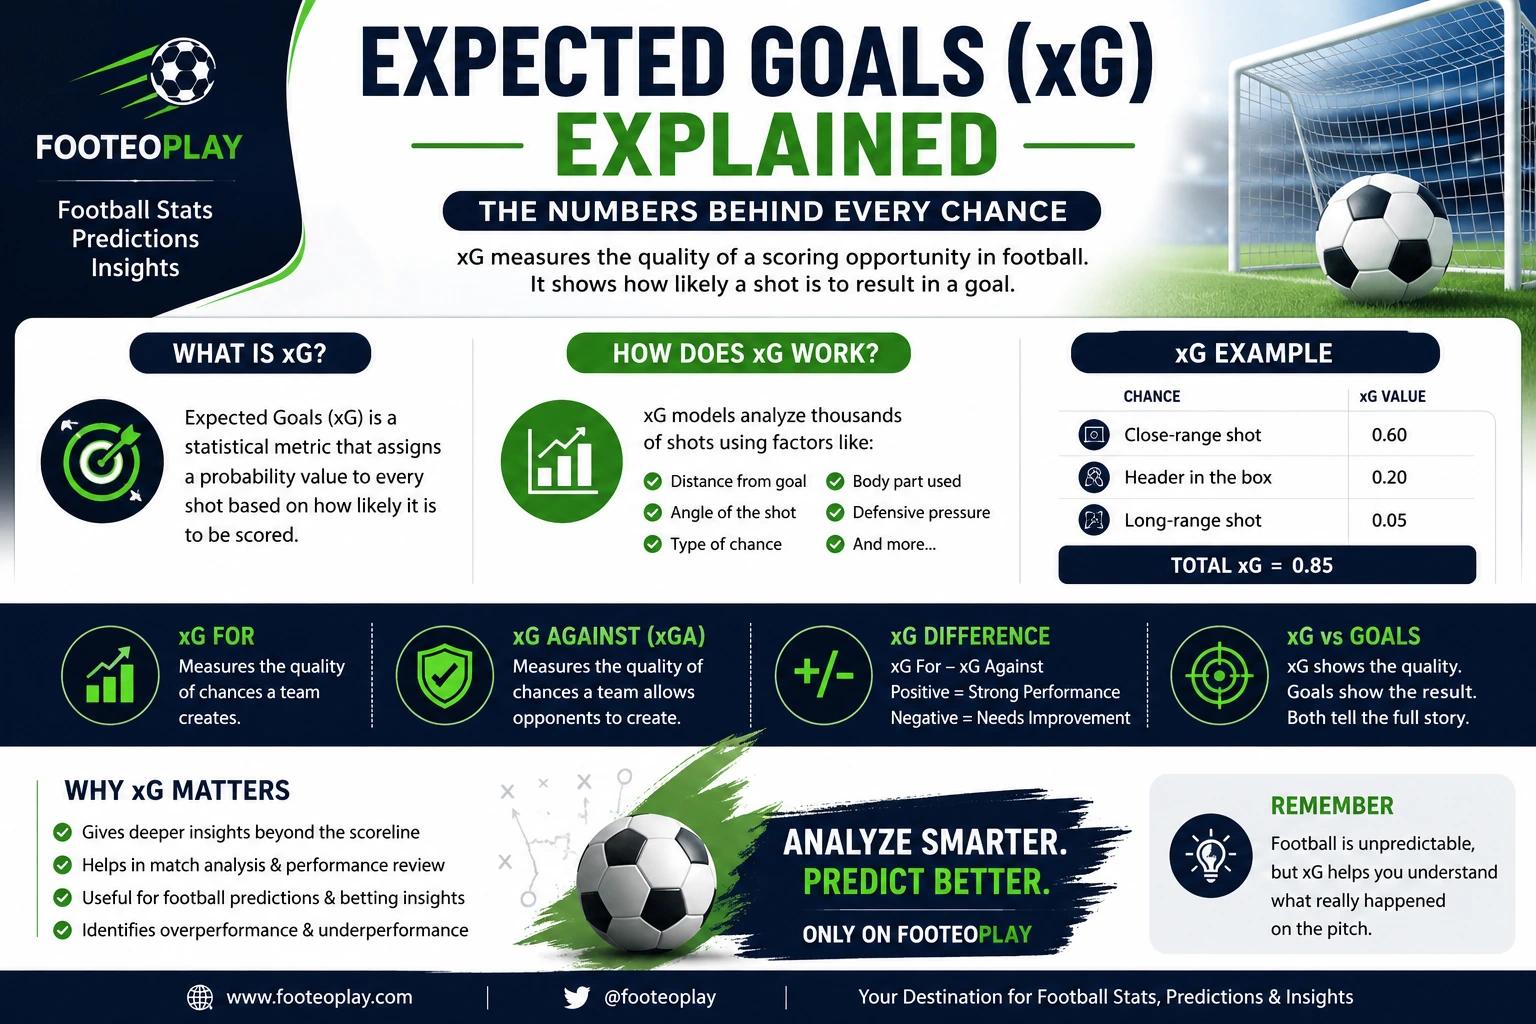
Football is no longer analysed only by goals, possession, shots, and league position. Modern football analysis increasingly uses advanced statistics to understand how well a team actually performed.
One of the most useful statistics is Expected Goals, commonly called xG.
But what is xG in football, and why do analysts use it when predicting matches?
In this guide, we explain expected goals in simple terms, how xG works, why it can be more useful than the final score alone, and how football fans can use xG when analysing upcoming matches.
At FooteoPlay, we use statistics, form, team performance, and match-specific analysis to make football predictions easier to understand.
What Is xG in Football?
xG stands for Expected Goals.
It is a statistical measurement that estimates how likely a particular shot is to result in a goal.
Every shot is given an xG value between 0 and 1.
For example:
- A penalty might have a relatively high xG value.
- A close-range shot in front of an open goal could have an extremely high xG.
- A long-range shot from outside the box usually has a very low xG.
Imagine a team creates five chances with the following xG values:
0.10 + 0.20 + 0.40 + 0.15 + 0.05 = 0.90 xG
That means the team generated approximately 0.90 expected goals from those chances.
Importantly, xG does not say the team will score exactly 0.90 goals. It describes the quality and probability of the chances created.
How Does Expected Goals Work?
xG models are built using large amounts of historical football data.
A model can consider factors such as:
- Distance from the goal
- Angle of the shot
- Type of chance
- Body part used
- Whether the shot followed a cross
- Whether the shot came from a set piece
- Position of defenders
- Location on the pitch
- Previous actions leading to the shot
Different football data providers use different models, so two websites can sometimes report slightly different xG numbers for the same match.
The important point is that xG measures chance quality rather than simply counting shots.
Why Is xG Important?
Consider two teams.
Team A
- 18 shots
- 2 shots on target
- 0.65 xG
Team B
- 8 shots
- 5 shots on target
- 1.90 xG
Team A had more shots, but Team B created much better opportunities.
This is why simply looking at the number of shots can sometimes be misleading.
A team can dominate possession, take 20 shots, and still create poor-quality chances.
Another team might have only eight shots but create several high-quality opportunities.
xG helps reveal the difference.
xG vs Actual Goals
One of the most interesting ways to use expected goals is to compare it with the actual score.
For example:
Team A: 3 goals from 1.1 xG
This could indicate an unusually efficient attacking performance.
Another example:
Team B: 0 goals from 2.2 xG
The team may have created enough opportunities to score but failed to finish them.
This does not automatically mean the results will reverse in the next match.
However, over multiple matches, the comparison between actual goals and xG can provide useful information about attacking efficiency and finishing performance.
What Does xG Mean for Match Predictions?
xG becomes particularly useful when analysing a specific football match.
Suppose a team has recently recorded:
- 1.8 xG
- 2.1 xG
- 1.6 xG
- 2.3 xG
- 1.9 xG
Even if the team has not won every match, this pattern suggests it is consistently creating chances.
Now compare that with a team producing:
- 0.7 xG
- 0.9 xG
- 0.6 xG
- 1.0 xG
- 0.8 xG
The second team may be struggling to create quality opportunities.
When analysing an upcoming fixture, xG can therefore be combined with:
- Recent form
- Home and away performance
- Injuries and suspensions
- Head-to-head trends
- Defensive performance
- Goals scored and conceded
- Expected goals for and against
- Recent tactical changes
The goal is not to rely on one number.
The goal is to build a better overall picture of the match.
What Is xGA?
You may also see another statistic called xGA.
xGA means Expected Goals Against.
While xG measures the quality of chances a team creates, xGA measures the quality of chances a team allows its opponents to create.
For example:
Team A
- xG: 1.75
- xGA: 0.95
This suggests the team is creating relatively strong attacking opportunities while limiting opposition chances.
A team with:
xG: 0.85
xGA: 1.85
may have problems at both ends of the pitch.
This is why analysts often look at both attacking and defensive expected-goals numbers.
xG Differential: A Useful Metric
Another useful statistic is xG differential.
The basic idea is:
xG Differential = xG - xGA
For example:
1.80 xG - 1.00 xGA = +0.80
A positive differential suggests that a team is creating better chances than it is allowing.
A negative differential can indicate the opposite.
Over a larger sample of matches, xG differential can be useful for identifying teams that are genuinely controlling the quality of chances.
Can xG Predict Football Matches?
xG can improve football analysis, but it is not a crystal ball.
Football is unpredictable.
A team can generate 2.5 xG and score zero goals. Another team can generate 0.6 xG and somehow win 2-0.
This can happen because of:
- Finishing quality
- Goalkeeper performances
- Defensive mistakes
- Red cards
- Penalties
- Game state
- Tactical changes
- Random variation
Therefore, xG should be treated as one part of a prediction model, not the entire prediction.
Example: Sirius vs Brommapojkarna Prediction Analysis
When researching a fixture such as Sirius vs Brommapojkarna, looking only at the league table may not provide enough information.
A stronger match analysis can examine:
Sirius attacking numbers
How much xG has Sirius generated in recent matches?
Sirius defensive numbers
How much xGA are they allowing?
Brommapojkarna attacking numbers
Are they consistently creating high-quality chances?
Brommapojkarna defensive numbers
Are opponents regularly creating dangerous opportunities?
Home and away trends
Does either team perform significantly differently depending on the venue?
Recent match performance
Are recent results supported by their underlying chance creation?
This approach provides a much deeper picture than simply saying one team has won more matches recently.
For FooteoPlay readers, a detailed fixture article can combine these statistics with form and tactical information to create a clearer Sirius vs Brommapojkarna prediction.
Example: AZ Alkmaar vs ADO Den Haag Timeline Analysis
Another useful type of football search is a match timeline analysis.
For a fixture such as AZ Alkmaar vs ADO Den Haag, fans may want more than just the final result.
A complete timeline can explain:
- Kick-off
- Early attacking pressure
- Shots and dangerous attacks
- Goals
- Yellow cards
- Substitutions
- Momentum changes
- Second-half opportunities
- Final score
Combining the timeline with xG can make the analysis even more useful.
For example, a team could score early and dominate the final score while its opponent creates several high-quality opportunities later in the match.
The score tells you what happened.
The underlying statistics can help explain why it happened.
What Is a Good xG Number?
There is no single xG number that automatically means a team will score.
The context matters.
For an individual shot:
0.05 xG means the chance is relatively unlikely to become a goal.
0.50 xG represents a much stronger chance.
0.80 xG represents a very high-quality opportunity.
For a full team performance, the interpretation depends on:
- Opposition quality
- Match location
- Number of chances
- Competition
- Tactical situation
- Game state
That is why comparing xG across several matches is generally more informative than looking at one match in isolation.
What Is the Difference Between xG and Shots on Target?
Shots on target tell you whether an attempt was heading toward the goal.
xG focuses on how likely that attempt was to become a goal.
Imagine:
Team A: 10 shots on target, 0.85 xG
Team B: 4 shots on target, 1.60 xG
Team A appears more dangerous if you only look at shots on target.
But Team B created higher-quality opportunities.
This is one of the reasons modern football analysts use multiple statistics instead of one basic metric.
How to Use xG When Analysing Football Predictions
A practical approach is to follow five steps.
1. Check recent xG
Look at the team's xG over the last several matches.
Try to identify a consistent trend rather than focusing on one game.
2. Check xGA
A team can have strong attacking numbers but poor defensive numbers.
Looking at both sides gives a more balanced picture.
3. Compare home and away performance
Some teams are significantly stronger at home than away.
This can influence the interpretation of their recent xG numbers.
4. Compare underlying performance with results
Ask whether recent wins and losses are supported by the underlying numbers.
A team winning repeatedly with very low xG may be performing above what its chance creation suggests.
5. Add football context
Statistics should be combined with real-world factors such as injuries, suspensions, tactics, motivation, and expected lineups.
This is where match-specific analysis becomes much more valuable.
Why Long-Tail Football Keywords Matter
For football websites competing in search engines, broad keywords such as:
"football predictions"
"expected goals"
"football tips"
can be extremely competitive.
Long-tail searches are often more specific.
Examples include:
- What is xG in football?
- Expected goals explained
- How does xG work?
- Sirius vs Brommapojkarna prediction
- Sirius vs Brommapojkarna xG
- AZ Alkmaar vs ADO Den Haag timeline
- AZ Alkmaar vs ADO Den Haag prediction
- Football xG analysis
- Team expected goals analysis
- Match xG prediction
These searches usually show a much clearer user intent.
A strong content strategy for FooteoPlay should therefore combine evergreen football guides with specific match-analysis articles.
Build a Football Content Cluster Around xG
Instead of publishing one article about expected goals and stopping there, build a topic cluster.
A possible FooteoPlay structure could be:
Pillar Article
- What Is xG in Football? Complete Expected Goals Guide
Supporting Articles
- xG vs xGA Explained
- What Is xG Differential?
- How Expected Goals Are Calculated
- xG vs Shots on Target
- How to Use xG for Football Predictions
- Best Football Stats for Match Analysis
Match Articles
- Sirius vs Brommapojkarna Prediction
- Sirius vs Brommapojkarna xG Analysis
- AZ Alkmaar vs ADO Den Haag Prediction
- AZ Alkmaar vs ADO Den Haag Timeline
- [Team] vs [Team] Prediction & xG Analysis
This creates multiple internal linking opportunities and helps establish a stronger topical relationship around football analysis.
Final Thoughts
Expected Goals is one of the most useful statistics for modern football analysis.
It does not tell you exactly what the final score will be. Instead, it provides a way to evaluate the quality of chances created and conceded.
When xG is combined with recent form, xGA, home and away performance, injuries, tactics, and match context, it can make football analysis significantly more informative.
For football fans looking beyond simple scores and league tables, understanding xG is a valuable step toward smarter match analysis.
Explore more football predictions, match analysis, statistics, and football insights on FooteoPlay.